Crypto & stock market reports, explained
A market report needs more than a green arrow. MonkeyReport helps you check a price move and describe it clearly. Enter your own observations below to build a small report for a stock or crypto holding. The calculator uses your numbers only. It does not retrieve quotes, predict prices, or connect to an account.
Your price-change report
Use the same asset, currency, and price source for both observations. Quantity means the number of shares or coins held throughout the comparison. The preset numbers are hypothetical.
How the calculation works
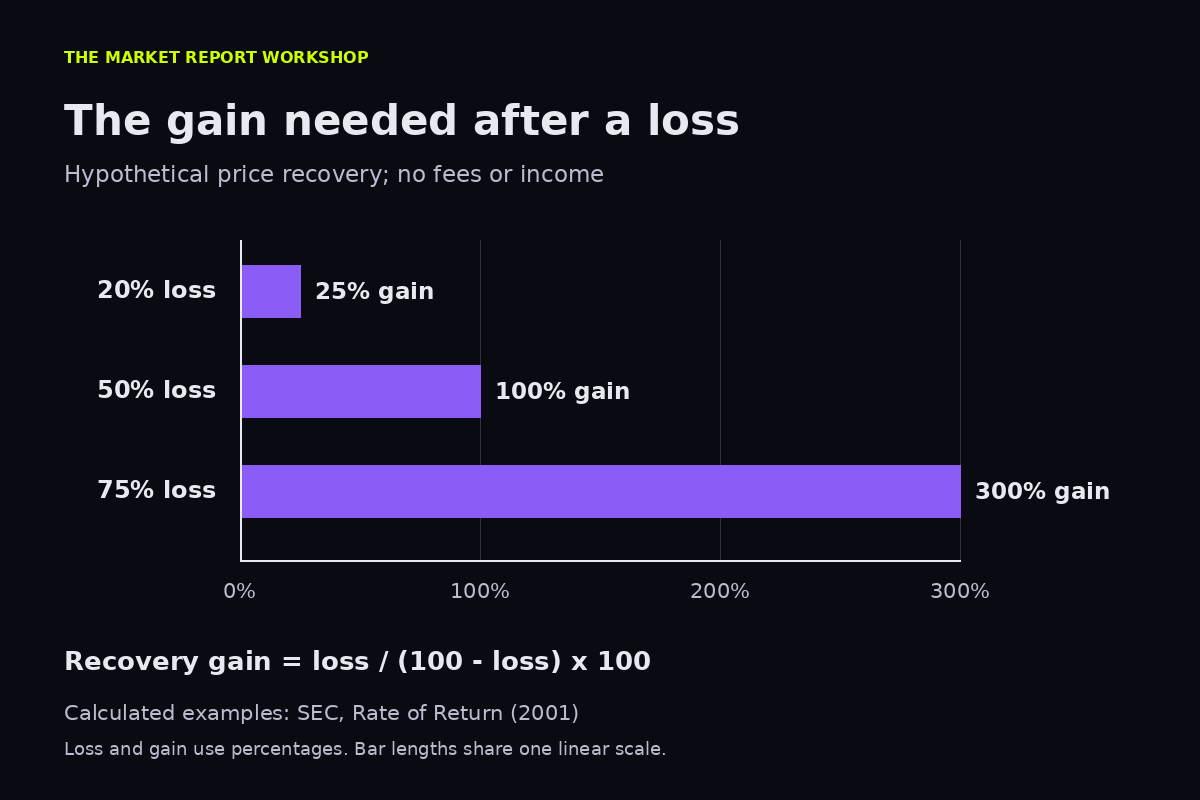
Price change equals (ending price − starting price) ÷ starting price × 100. Position change equals (ending price − starting price) × quantity. If the ending price is below the start, recovery gain equals (starting price ÷ ending price − 1) × 100. These are changes across your chosen period, not annualized returns.
The U.S. Securities and Exchange Commission (SEC), Rate of Return (2001), explains percentage change using the original investment value. Our recovery formula applies that arithmetic to the lower ending value. Inputs run locally in your browser. Results exclude income, fees, taxes, currency conversion, borrowing, and changes in quantity.
Why equal percentages do not cancel
In our hypothetical example, a price falls from $100 to $80. That is a 20% loss. Returning from $80 to $100 requires a 25% gain because the second calculation starts from $80. With 10 units, the position falls from $1,000 to $800. The $200 change says nothing about when, or whether, recovery will occur.
Turn a price move into a useful report
- Define the observation. Write the asset name, currency, source, and timestamp beside each price. Record the time zone. Keep those notes with your result so another reader can repeat the comparison.
- Define the comparison. Decide whether you want a session, week, or holding-period comparison before selecting prices. Do not change the starting point simply because another date makes the result look better.
- Explain the boundary. Call this output a price change. If your quantity changed, calculate each unchanged holding separately. Do not describe a deposit as market profit or use this simple tool as an account-performance statement.
A useful report separates observations from explanations. Write what changed first. Then list the evidence for any proposed cause. If you cannot check a headline against an original announcement, label the explanation as unverified. A price move alone does not establish why buyers or sellers acted.
Read beyond the headline percentage
Price change and total return measure different things. FINRA, the Financial Industry Regulatory Authority, explains in Key Concepts: Return and Rate of Return (2017) that total return includes investment earnings as well as a change in value. A stock dividend therefore belongs in a broader return calculation. This tool deliberately leaves that separate.
Costs also matter. The SEC bulletin How Fees and Expenses Affect Your Investment Portfolio (2025) explains that transaction and ongoing fees reduce investment returns. Check your actual charges before treating a positive price move as a profit. A quote is an input here; it is not a promise about the amount a sale would produce.
The SEC bulletin Performance Claims (2022) advises readers to examine methods, expenses, comparison periods, and benchmarks. It also warns that past performance cannot predict future results. When you compare reports, check that both use compatible periods and return definitions. Keep hypothetical examples separate from observed market data.
Limits and source notes
A zero ending price represents a complete price loss in this model. No finite percentage increase from zero restores the starting value. A blank or invalid field produces a correction message. Displayed results use rounded values; calculations use the entered precision. Educational tool, not financial advice.
Sources: SEC, Rate of Return (2001); FINRA, Key Concepts: Return and Rate of Return (2017); SEC, Investor Bulletin: Performance Claims (2022); SEC, How Fees and Expenses Affect Your Investment Portfolio (2025). The chart shows our calculated examples, not historical returns. Editorial review: October 28, 2026.